Skip to Main Content
Menu
Contact
Search
Search this site:
Search
Home
Portals
Is our water safe to drink?
Is it safe to swim in our waters?
Is it safe to eat fish and shellfish from our waters?
Are our Aquatic eco systems healthy?
Wetlands
Estuaries
Streams, Rivers & Lakes
Ocean & Coastal
Are Harmful Algal Booms Affecting Our Waters?
About Us
California Environmental Protection Agency
California Natural Resources Agency
California Water Quality Monitoring Council
Announcements
Background
Membership
Meetings
Products
More Information
Partners
Contact Us
Workgroups
Safe-to-Eat Workgroup
California CyanoHAB Network
California Estuary Monitoring Workgroup
California Wetland Monitoring Workgroup
California Water Quality Monitoring Collaboration Network
Data Management Workgroup
Healthy Watersheds Partnership
Ocean & Coastal Ecosystem Workgroup
Multi-Agency Rocky
Intertidal Network (MARINe)
Safe Drinking Water Workgroup
Safe-to-Swim Workgroups
HABs Links
Toolbox
Report a Bloom
HAB Incident Reports Map
Frequently Asked Questions
Resources for the Public - Protect Yourself, Family, Dogs, and Livestock
Healthy Water Habits
FAQs for HAB signs
FAQs for Toxic Algal Mats
Human Health Impacts
Dogs and Livestock Impacts
Fish and Wildlife Impacts
HAB-Related Illness Tracking
Drinking Water FAQs
Resources for Response Organizations
Signs and Guidance for HAB Response
Field Guide and Forms
Monitoring and Laboratory Analysis
HAB Data Viewer
Division of Drinking Water's HAB Resources
Resources for Mitigating HABs
HAB Related Programs and Organizations
Announcements
Training and Collaboration
HAB Data Viewer
Archived Data
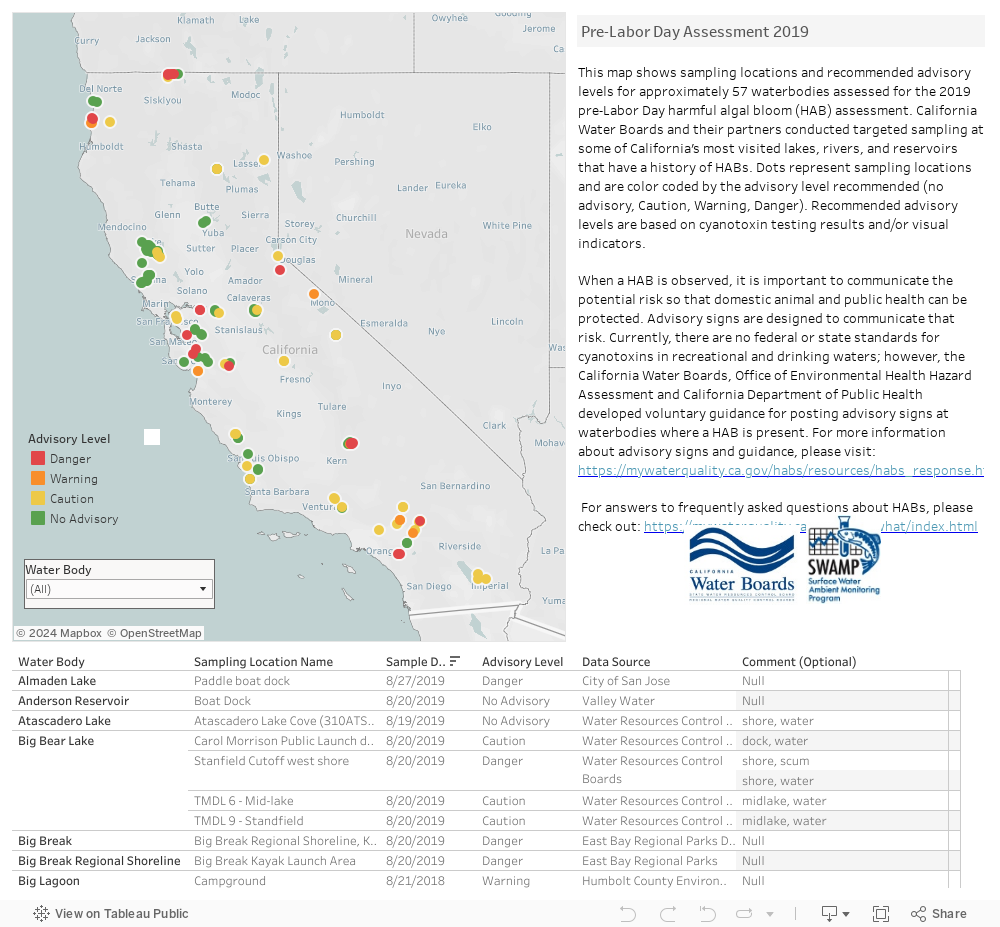
Pre-Labor Day Assessment 2019
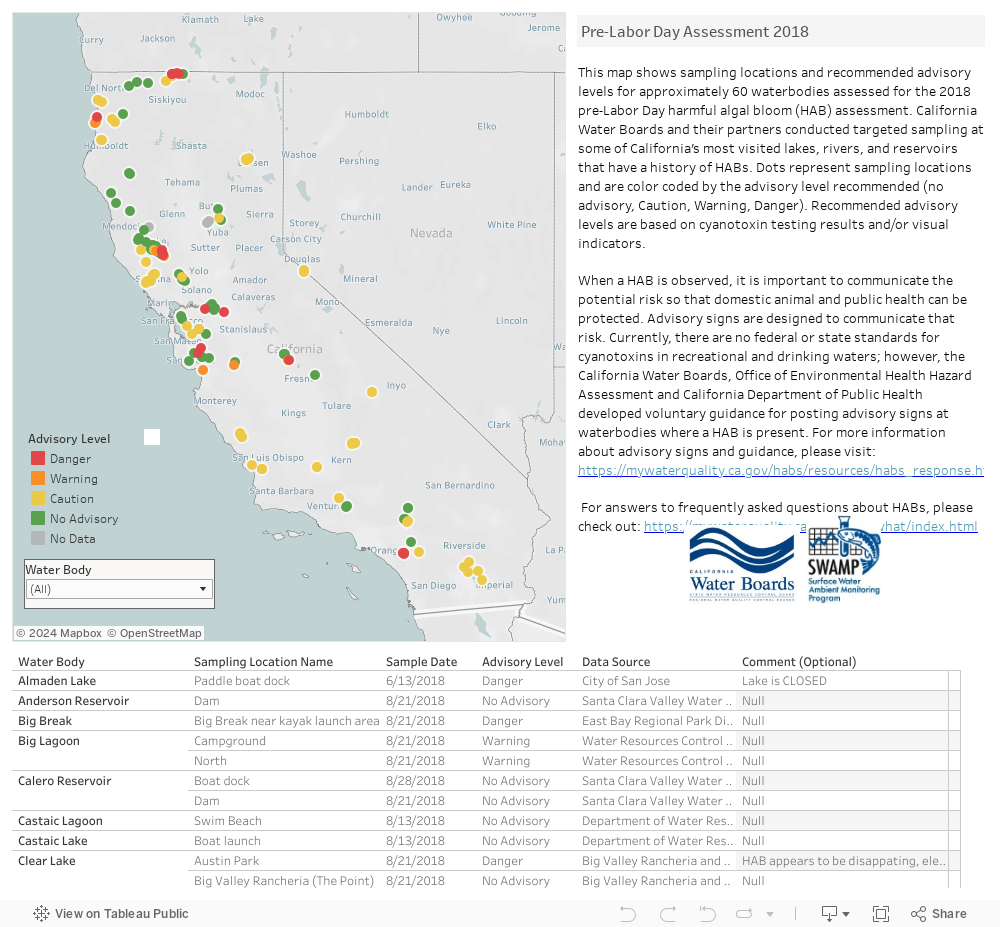
Pre-Labor Day Assessment 2018
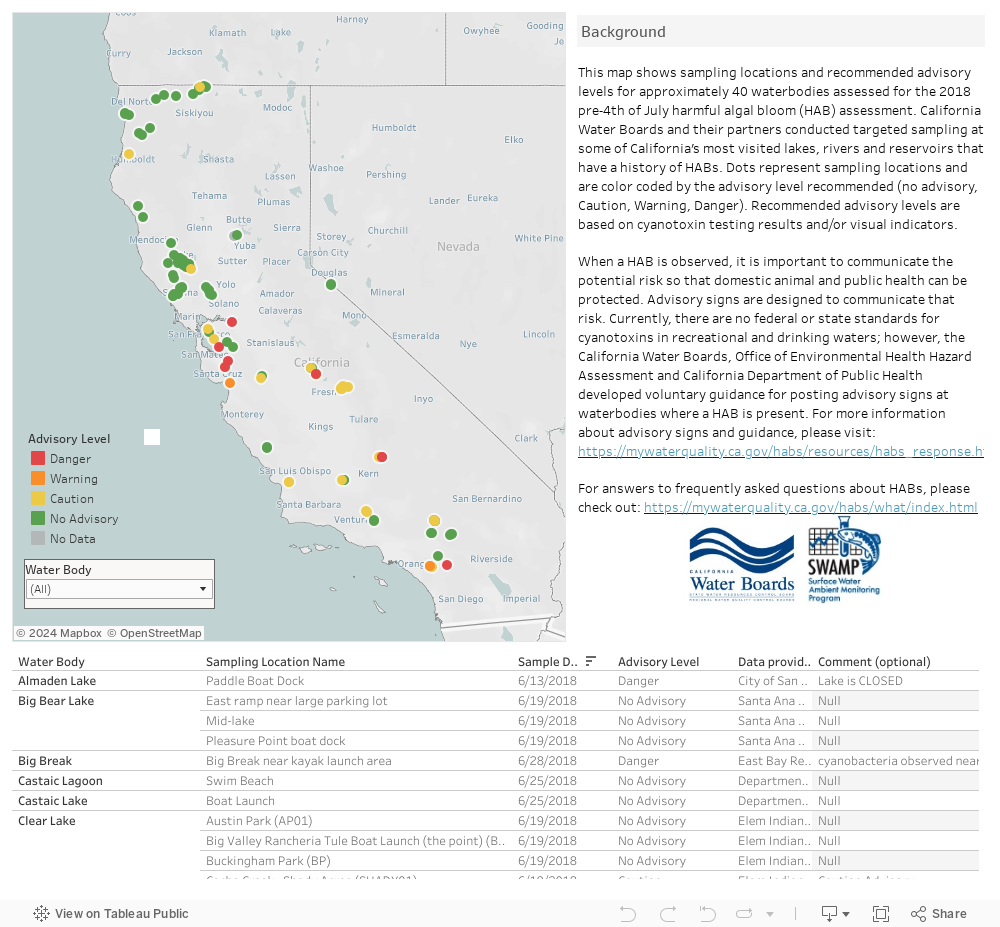
Pre-July 4th Assessment 2018
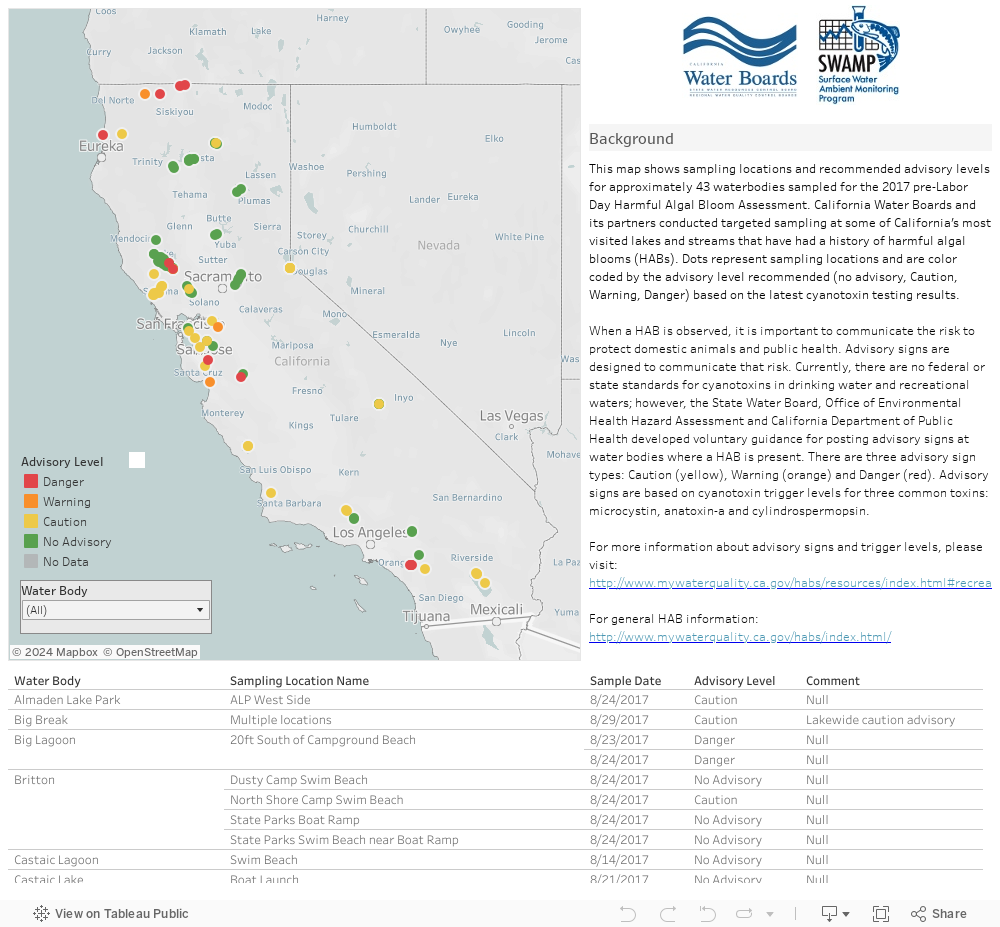
Pre-Labor Day Assessment 2017
(Updated 8/8/23)